The 7 best mobile app analytics tools
Jul 31, 2024


On this page
- 1. PostHog
- What is PostHog?
- How much does PostHog cost?
- Why do companies use PostHog?
- 2. Mixpanel
- What is Mixpanel?
- How much does Mixpanel cost?
- Why do companies use Mixpanel?
- 3. UXCam
- What is UXCam?
- How much does UXCam cost?
- Why do companies use UXCam?
- 4. Amplitude
- What is Amplitude?
- How much does Amplitude cost?
- Why do companies use Amplitude?
- 5. Firebase (Google analytics)
- What is Firebase?
- How much does Firebase cost?
- Why do companies choose Firebase
- 6. Appsflyer
- What is Appsflyer?
- How much does Appsflyer cost?
- Why do companies use Appsflyer?
- 7. Countly
- What is Countly?
- How much does Countly cost?
- Why do companies use Countly?
- Is PostHog right for you?
- Further reading
1. PostHog
Best for: Engineering and product teams
What is PostHog?
PostHog (that's us 👋) is an all-in-one platform built to help engineers create better products. It includes product analytics and a whole bunch more, such as A/B testing, feature flags, and session replays.
It's designed for product-minded engineers, growth teams, and product managers who need to move fast and iterate based on reliable, actionable insights.
Key features
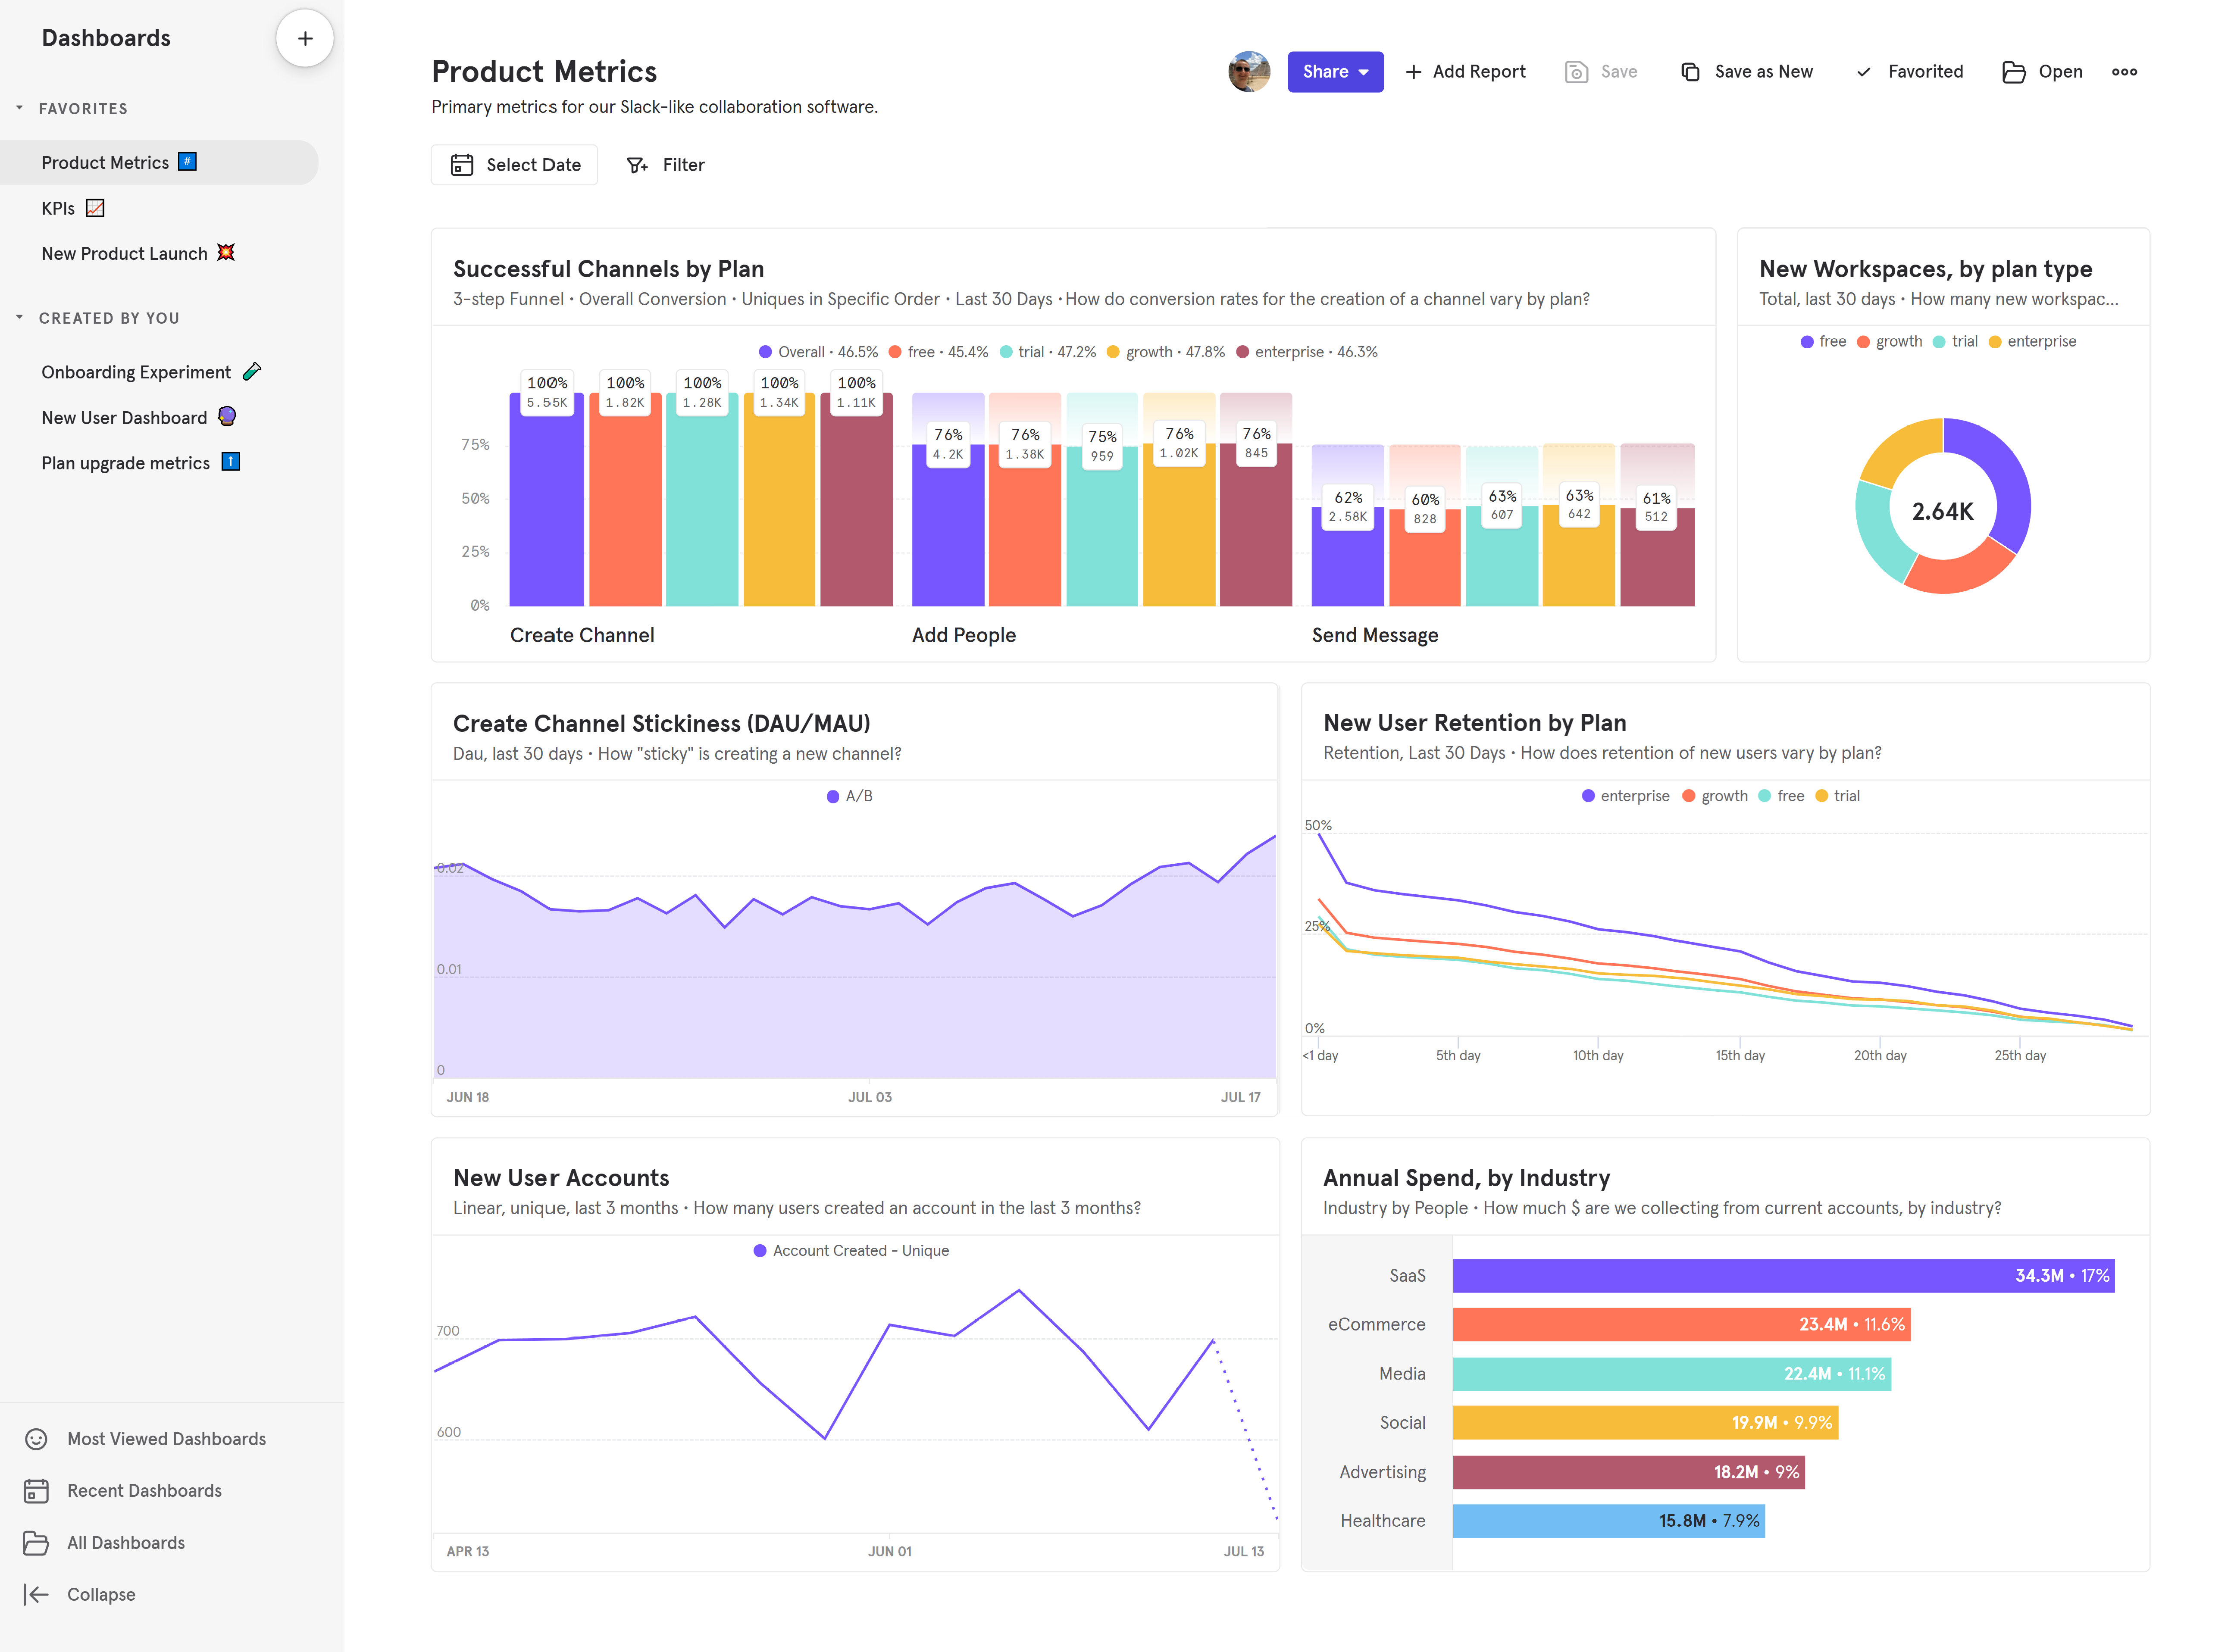
📈 Product analytics: Custom trends, funnels, user paths, retention analysis, and segment user cohorts. Also, direct SQL querying for power users.
📺 Session replays: View exactly how users are using your app. Includes event timelines, console logs, network activity, and 90-day data retention.
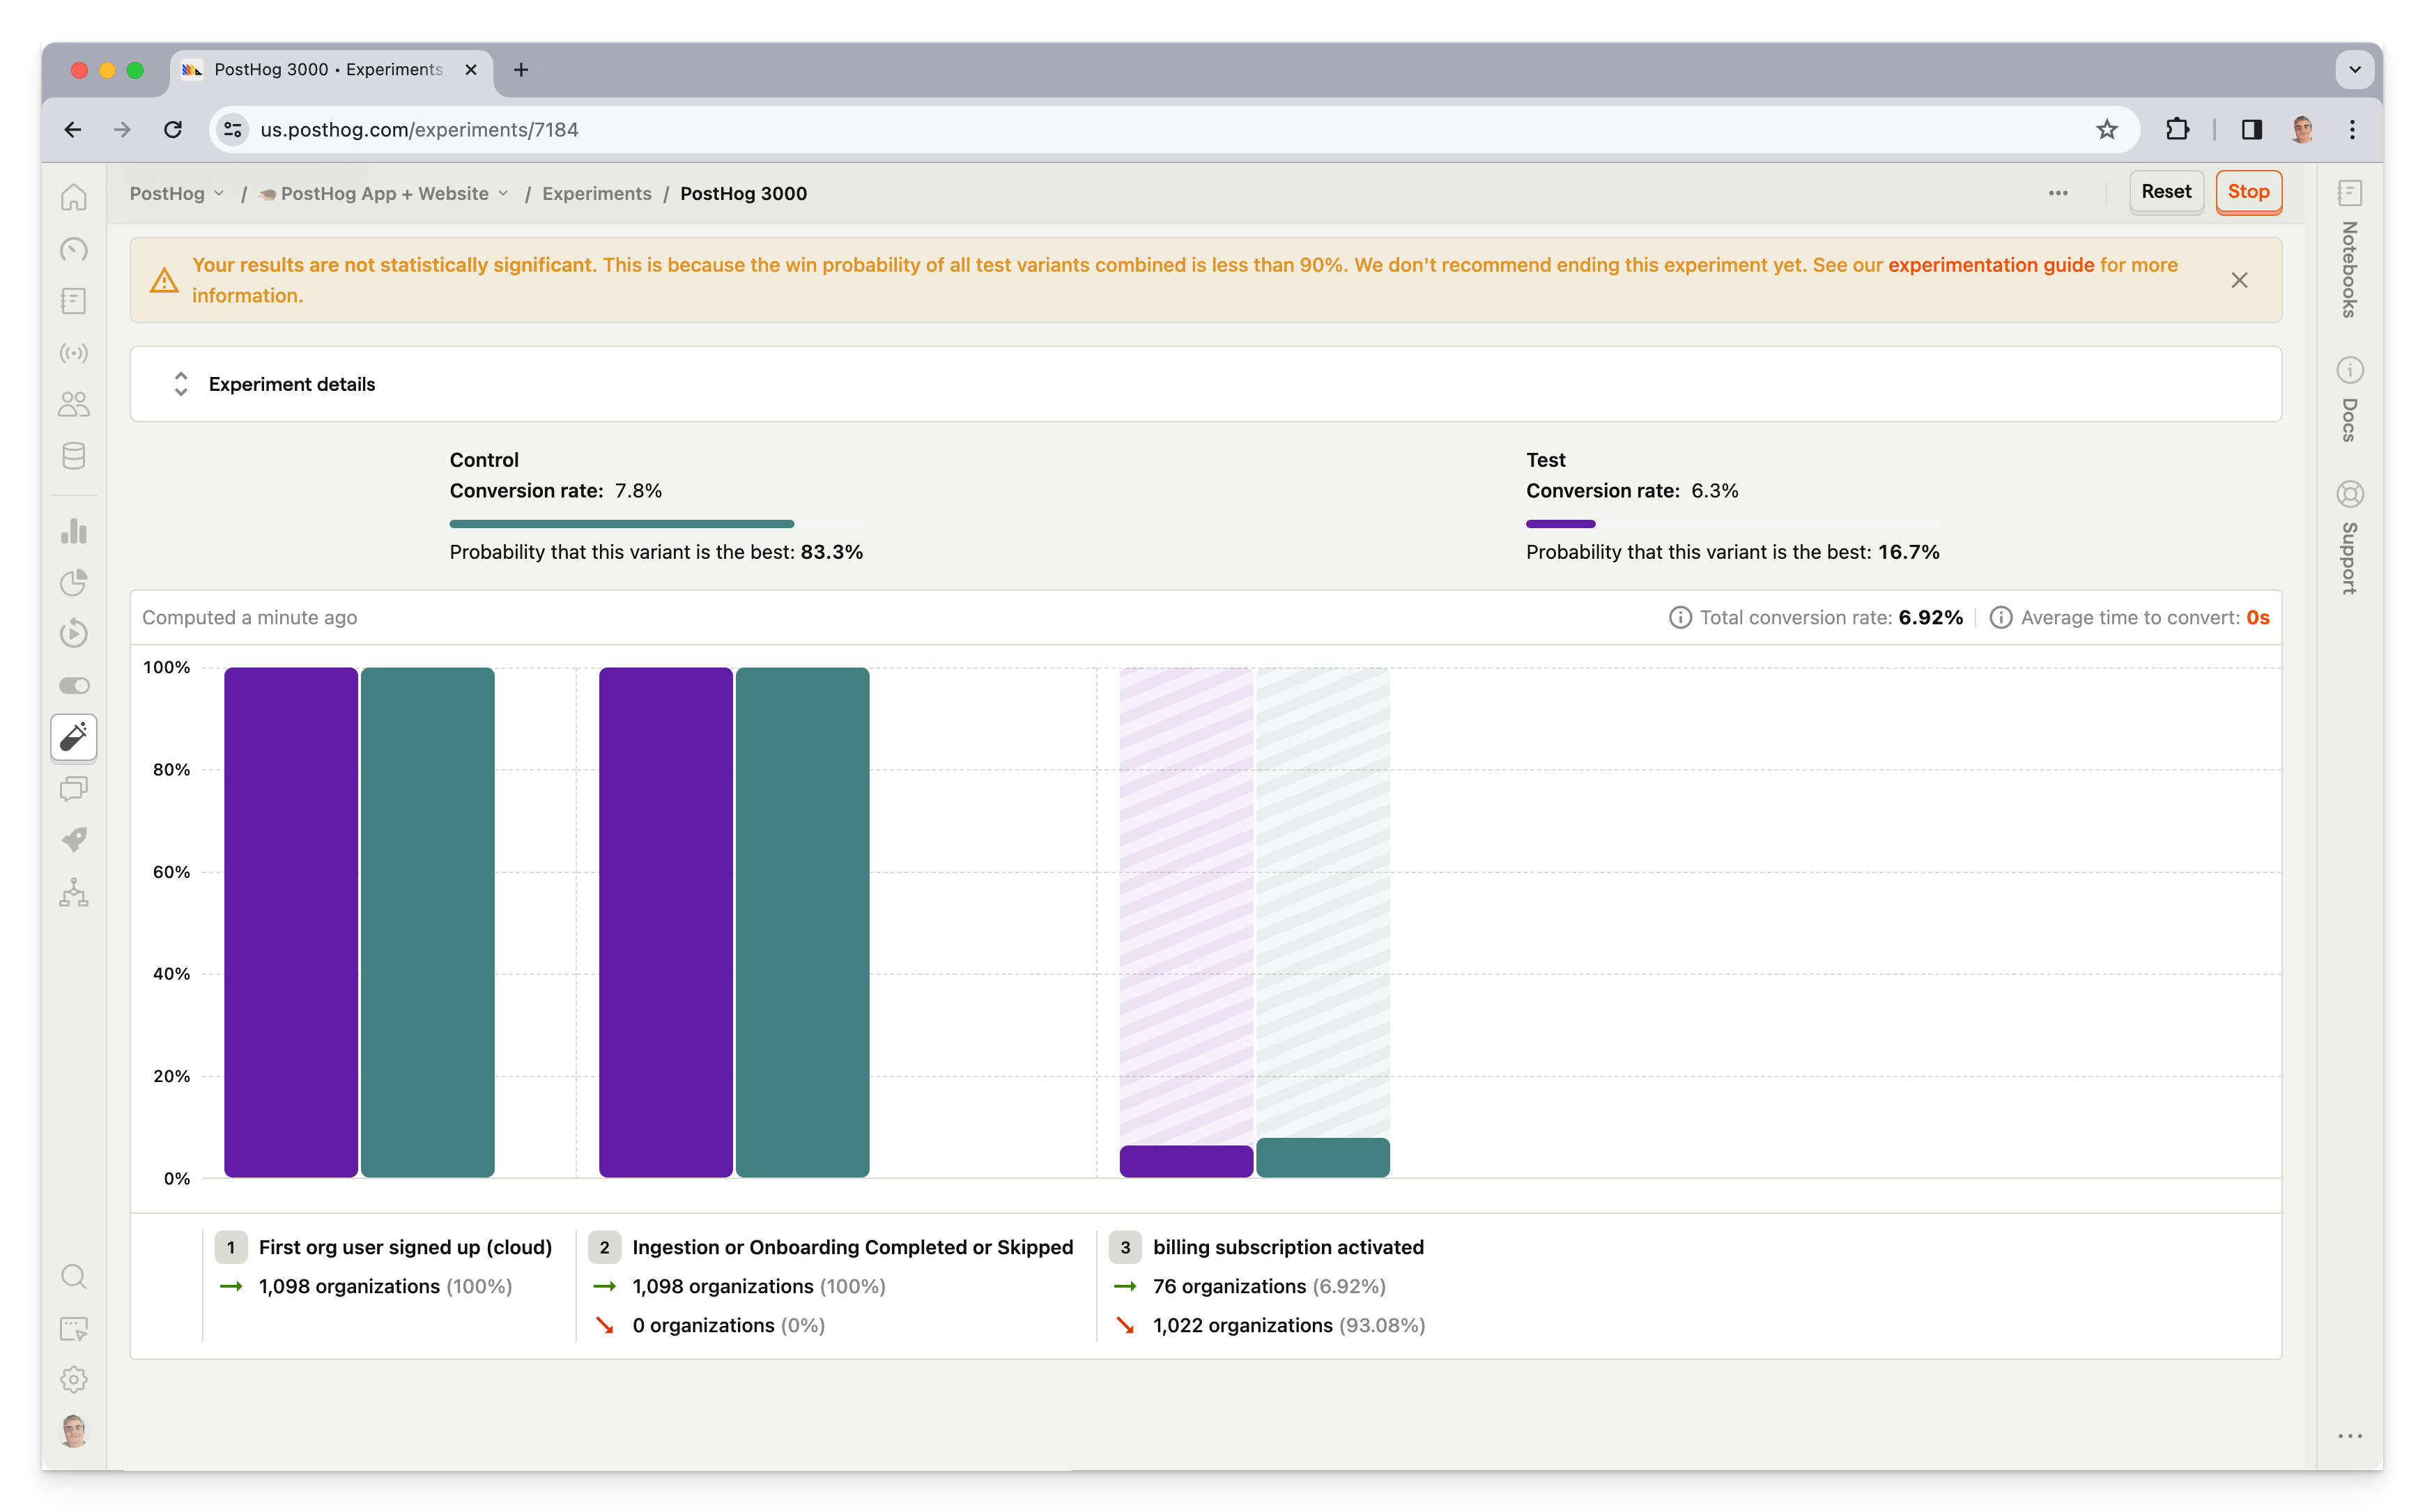
🧪 A/B tests: Experiment in your app with up to nine test variations and track impact on primary and secondary metrics. Auto-calculate test duration, sample size, and statistical significance.
🚩 Feature flags: Rollout features safely with local evaluation (for faster performance), JSON payloads, and instant rollbacks.
🏠 Data warehouse: Combine data from all your different sources for easy analysis and comprehensive insights.
How much does PostHog cost?
PostHog has transparent pricing based on usage. It’s free to get started and completely free for the first 1 million analytics events. After this free monthly allowance, pricing starts at $0.000248/event (or $2.48 for 10k events), and events cost progressively less the more you use. You can also set billing limits to ensure you don't get surprise bills.
Why do companies use PostHog?
According to G2 reviews, companies use PostHog because:
It's many tools in one: PostHog can replace tools like Mixpanel (analytics), UXCam (session replay), and Statsig (A/B testing and feature flags). This simplifies workflows and ensures all product data is in one place.
They need a complete picture of users: PostHog includes every tool necessary to understand users and build better products. This means creating funnels to track conversion, watching replays to see where users get stuck, and testing solutions with A/B tests.
Pricing is transparent and scalable: Reviewers appreciate how PostHog's pricing scales as they grow. There's a generous free tier. Companies eligible for PostHog for Startups also get $50k in additional free credits.
Bottom line
For teams looking for all the tools they need to improve their products, PostHog makes for a great choice. This is especially true for startups and scaleups thanks to it having a generous free tier.
2. Mixpanel
Best for: Product managers, desginers and marketing teams
What is Mixpanel?
Mixpanel is one of the most popular product analytics tools on the market. Founded in 2009, in recent years it's deprecated additional features, such as A/B testing, to focus on product analytics alone.
Key features
📊 Product analytics: Track user behavior, KPIs, and core metrics with trends, retention, and flows.
📝 Collaborative boards: Build analysis in collaborative boards that can include reports, text, videos, and GIFs. Embed these boards in other tools.
🚨 Alerts: Get automated notifications when there are anomalies in metrics or if they fall outside a positive or negative range.
🔎 Filtered data views: Hide and filter data on a per-team basis to reduce noise and separate data for privacy reasons.
How much does Mixpanel cost?
Pricing starts at $28/month for up to 10k events and scales with events. 1 million events cost $168/month.
Why do companies use Mixpanel?
Looking at G2 reviews, companies choose Mixpanel to:
Eliminate the need for data analysts: Mixpanel helps reviewers structure large volumes of data, and make data-driven decisions, reducing their reliance on dedicated data analysts to produce insights.
Track and target campaigns: Marketers appreciate the ability to create user segments and target specific users, enabling more personalized campaigns and improved user engagement.
Understand user behavior: In common with most analytics tools, Mixpanel's users mostly want to understand user behavior, identify bottlenecks, and monitor core metrics like conversion rates, activation, and retention.
Bottom line
Mixpanel is great for teams who want powerful yet easy to use analytics and don't need any of the extra features that other alternatives on this list provide.
3. UXCam
Best for: Product managers in enterprise companies
What is UXCam?
UXCam is a platform built solely for mobile apps. It includes a full-suite of analytics features as well as session replays and heatmaps.
It's designed to provide deep insights into user behavior, helping product managers understand how users interact with their apps.
Key features
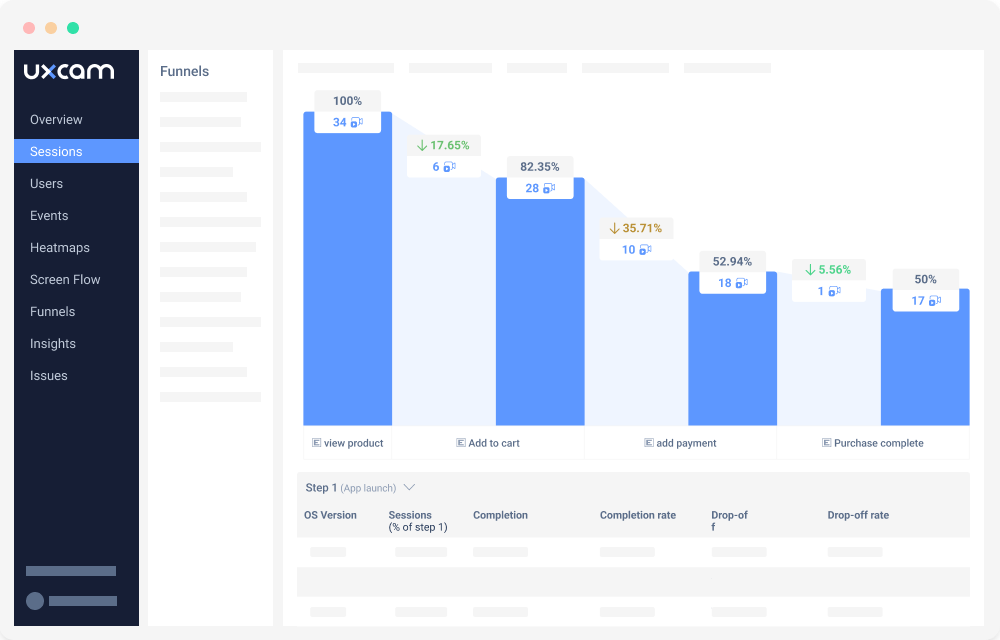
📈 Product analytics: Custom trends, funnels, user paths, retention analysis, and segment user cohorts.
📺 Session replays: View exactly how users are using your app. Includes event timelines, console logs, network activity, and 90-day data retention.
🔥 Heatmaps: See where users tap, where they scroll to, and the areas that get the most attention.
How much does UXCam cost?
UXCam's pricing is sales-driven and completely opaque, so it's not clear how much it costs. The company's sales team will give you a quote after you've spoken to them.
Why do companies use UXCam?
Looking at G2 reviews, companies choose UXCam because:
They need insights on user behavior: Insights show what users are doing, where their attention is going, and how they are spending their time. Users love the realizations they get with UXCam's tools.
It's easy to use: Reviewers note how easy UXCam is to set up and use. This means they can go from idea to actionable learnings quickly.
Heatmaps and scrollmaps: Seeing clicks and scroll depth works well and creates actionable insights for design and product teams. Helps improve UX and page designs.
Bottom line
UXCam is ideal for product managers who need in-depth insights into user behavior. Despite opaque pricing, its ease of use and actionable insights make it a valuable tool.
4. Amplitude
Best for: Product managers, data analysts, marketing teams
What is Amplitude?
Amplitude was one of the original product analytics tools. Many large enterprise customers, like Ford, NBCUniversal, and Walmart rely on it. In recent years, it’s also added A/B testing and feature flags.
Key features
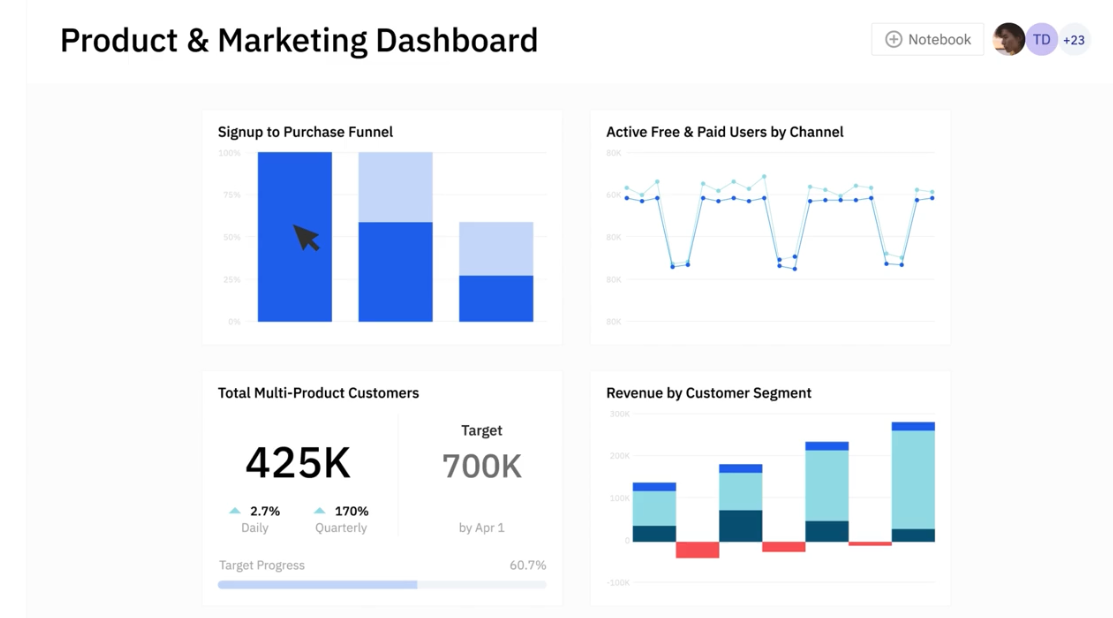
📈 Product analytics: Funnel and retention analysis, user paths, behavioral cohorts, custom dashboards, and more.
🧪 A/B testing: Test new features on specific targets and analyze with primary, secondary, and counter metrics.
👦 Customer data platform: Combine analytics data with third-party tools for data governance, identity resolution, and data federation.
🤖 AI insight builder: Generate insights based on natural language requests, like "What is my purchase conversion rate?"
How much does Amplitude cost?
Amplitude is the most expensive platform on this list. Pricing starts at $49/month for up to 1k events. 100k events cost $849/month.
Why do companies use Amplitude?
According to G2 reviews, people like Amplitude because:
It's simple to use: Amplitude makes it easy for non-technical users to get insights about their product and make improvements. Amplitude is built for users like product managers and marketers, making it a popular choice for them.
It offers built-in A/B testing: Amplitude offers integrated experimentation features. This enables companies to run experiments on existing cohorts, and then analyze the data in a single place.
It helps them become data-driven: Amplitude users appreciate it helps them become data-driven. It becomes easy to add data, visualize it, and make decisions, and they can use it as a source of truth thanks to its built-in customer data platform.
Bottom line
Like PostHog, Amplitude is a good option if you value powerful analytics and experimentation in one. If you don't need session replay or heatmaps, it can be a good choice.
5. Firebase (Google analytics)
Best for: Apps already using Firebase's other features
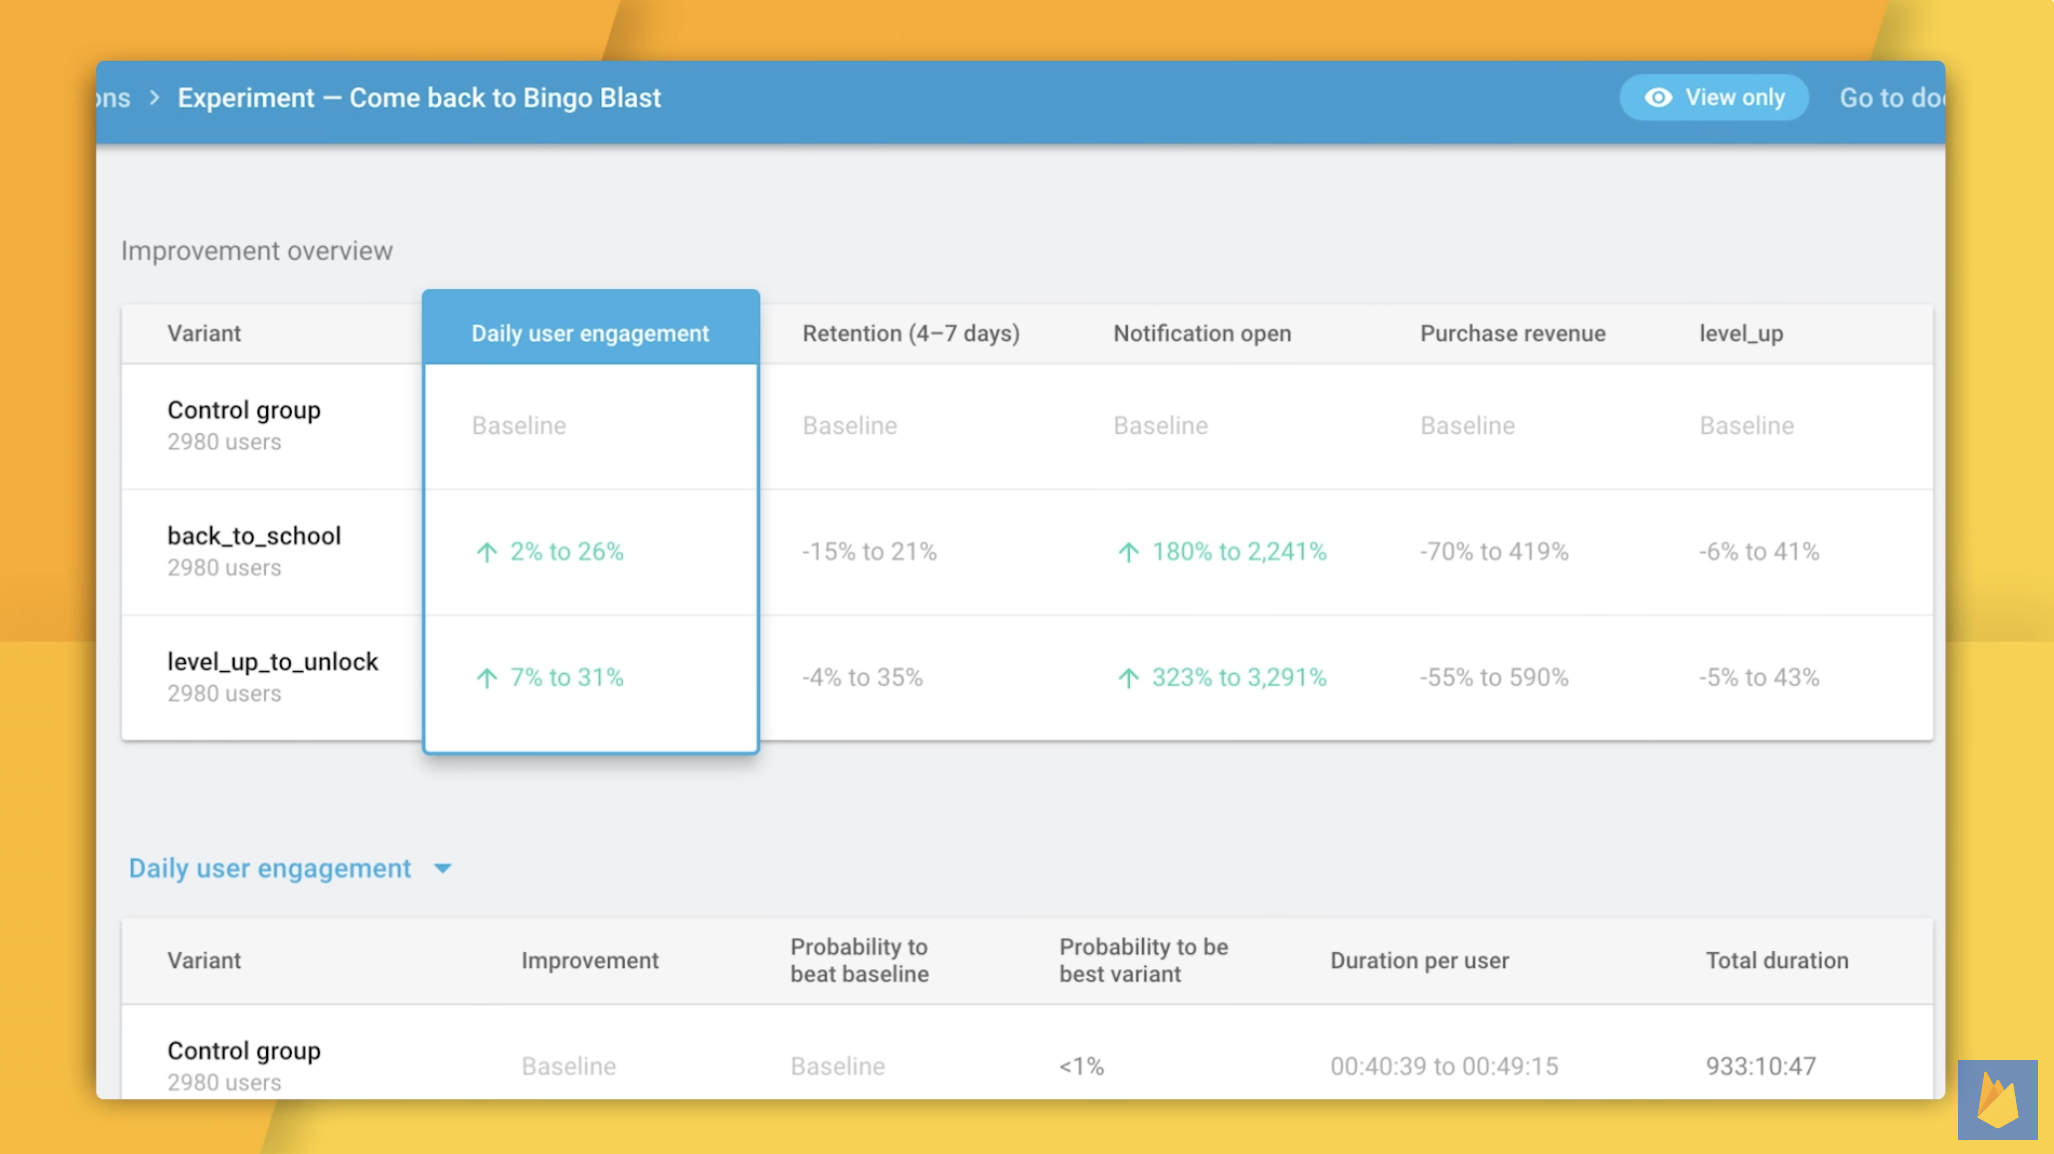
What is Firebase?
Firebase is Google's mobile app development platform. It includes analytics, realtime databases, push notifications, in-app messaging, and more. Its analytics feature is powered by Google Analytics.
Key features
📊 Comprehensive analytics: Gain in-depth insights into user behavior and app performance.
📈 Real-time data: Access real-time data on user interactions, app crashes, and performance metrics.
📲 Push notifications: Engage users with targeted push notifications based on their behavior and preferences.
💬 In-app messaging: Send personalized messages to users within your app to guide them through key actions.
How much does Firebase cost?
Since Firebase is powered by Google Analytics, it follows the same pricing. It has a generous free tier that's sufficient for most startups. Larger enterprises with higher data collection and export requirements will need to upgrade to GA360, which starts at $50,000 per year.
A good rule of thumb is that if you're exporting more than 1 million events per day, or querying data with more than 10 million events, you'll need to upgrade to GA360. See Google's breakdown for more.
Why do companies choose Firebase
According to G2 reviews, companies choose Firebase because:
It's a comprehensive toolkit: Firebase offers a broad range of tools beyond analytics, such as push notifications, in-app messaging, and Crashlytics, making it an all-in-one tool for app development and management.
It's easy to use: Reviewers appreciate how easy Firebase is to use, making app management simple.
It integrates with other Google services: Firebase integrates smoothly with other Google services, providing a powerful development and analytics ecosystem.
Bottom line
Firebase analytics is a great choice for companies already leveraging it's other features or any of Google's other products.
6. Appsflyer
Best for: Marketing teams
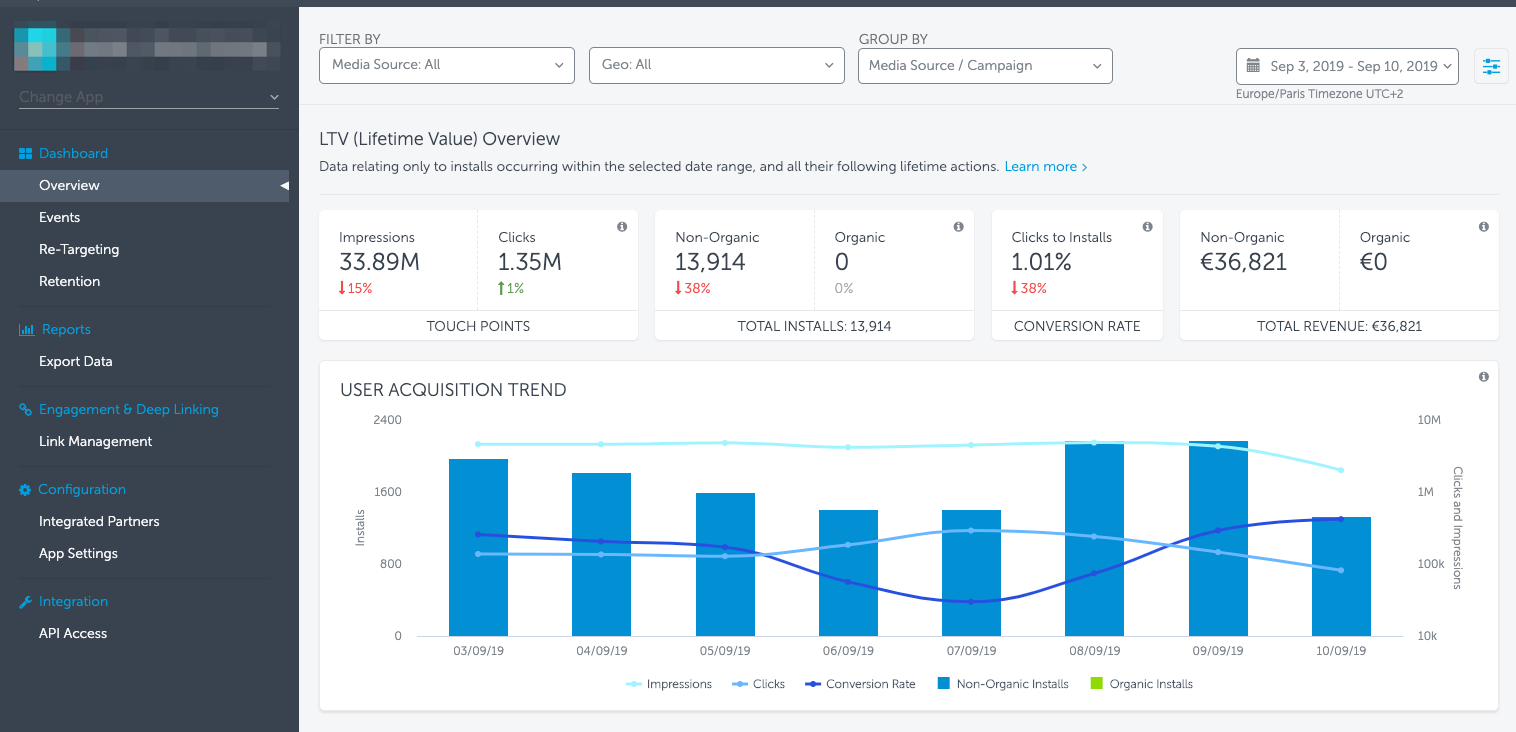
What is Appsflyer?
Appsflyer is a platform that focuses on marketing analytics and, unlike other platforms on this list, it doesn't include product analytics. Instead, it focuses on attribution to help teams measure, analyze, and optimize their marketing efforts.
Key features
🔗 Attribution: Appsflyer provides detailed attribution data, allowing marketers to see which campaigns, channels, and touchpoints are driving installs and conversions.
🔍 Marketing analytics: Turn insights on campaign performance into actionable strategies to improve your marketing.
💰 ROI measurement: Understand your true mobile marketing ROI, enabling you to optimize your spend effectively.
🚨 Fraud protection: Advanced mobile app fraud detection and prevention tools help protect your ad spend.
How much does Appsflyer cost?
Since it focuses on marketing analytics, Appsflyer charges $0.07 per conversion events. Examples of conversion are app installs, in-app purchases, and sign-ups.
Why do companies use Appsflyer?
According to G2 reviews, companies use Appsflyer because:
They need comprehensive attribution insights: Appsflyer enables marketers to understand which campaigns and channels are driving the best results.
It's easy to use: Reviewers note how easy Appsflyer is to use. This means they can go from idea to actionable learnings quickly.
It has a wide range of integrations: Appsflyer can connect to many different marketing tools, making it easier to manage and analyze data from multiple sources.
Bottom line
Appsflyer is the top choice for marketing teams looking to optimize their ad spend and gain deep insights into their campaigns.
7. Countly
Best for: Teams in strict regulatory environments

What is Countly?
Countly is privacy-focused product analytics platform. It emphasizes 100% data ownership and privacy compliance, supporting regulations like GDPR, HIPAA, and CCPA. Users have full control over their data, which can be self-hosted or managed in a private cloud.
Key features
📊 Product analytics: Track user behavior, application performance, and key metrics with customizable dashboards.
🌐 Privacy compliance: Ensure compliance with GDPR, HIPAA, CCPA, and other privacy regulations.
💬 Push notifications: Engage users with personalized push notifications based on their behavior and preferences.
🚨 Crash analytics: Monitor and resolve app crashes with detailed reports and real-time alerts.
How much does Countly cost?
Countly has different tiers based on number of active users. To give you an idea of how much it charges per active user, below is a list of its first four tiers:
- Free up to 1k MAU
- $80/month for up to 2k MAU.
- $190/month for up to 5k MAU.
- $350/month for up to 10k MAU.
Why do companies use Countly?
Based on G2 reviews, companies choose Countly because:
It's focused on privacy and compliance: Countly ensures that companies can adhere to strict regulatory requirements.
It's many tools in one: From push notifications to A/B testing to crash analytics, Countly provides many features for building great apps.
You have full data ownership: With options for self-hosting and private cloud, Countly enables companies to manage their data securely.
Countly is a great choice if you're building a strict regulatory environment. Many users complain about its bad user interface though.
Is PostHog right for you?
Here's the (short) sales pitch.
We're biased, obviously, but we think you'll love PostHog if:
- You value transparency (we're open source and open core)
- You want tools to ship, track, and analyze new features – like A/B testing, feature flags, and session replays
- You want try before you buy (we're self-serve with a generous free tier)
Check out our product pages and read our docs to learn more.
Ready to find out more?
Further reading
- The 9 best mobile app A/B testing tools
- 7 best session replay tools for mobile apps (iOS & Android)
- The 9 best GDPR-compliant analytics tools